
The biggest learning for a B2C Marketer is their ability to identify and measure the right metrics for a campaign. Unfortunately, most from the community waste valuable productive hours and marketing dollars chasing vanity metrics as opposed to the actionable ones.
Each Marketing campaign is unique and has several associated metrics that guide a Marketer of its success or failure. For example, the metrics for a social media campaign will differ from E-marketing metrics and so on (you get the drift).

As referral marketing evangelists, we decided to list the metrics that matter while running a referral campaign. The article also includes formulas (yes, we hear you), that can help you do that in case you hate excels like me!
It’s for a reason that we call it the ultimate list of referral marketing metrics!
Referral Marketing Metrics That Matter
Even before I go on to share the right metrics, it is important that you agree with me on certain levels. It is crucial that we are on the same page while evaluating the right metrics for gauging the success of a referral campaign.
- More data does not always mean a better campaign lifecycle.
- Not all data is helpful.
- Data that can help you take decisions is the most significant.
Having understood the true essence of measuring data, let’s look at each of the metrics from a closer angle.
Section 1- Broad Metrics
Active Users Sending Invites
Monthly active users in SaaS business models usually mean the number of unique users during a specific period of time. However, in the case of referral marketing, this metrics is slightly different. Given that Marketers leverage existing users to put ‘refer-and-earn’ in motion, monthly active users should be measured as active users sending invites while measuring the effectiveness of referral campaign.
In a nutshell, it means the number of users who participated in your referral campaign for a given period (usually last 30 days).
The formula to derive Active users sending invites is as straightforward as the metric itself
AUSI as a metric correlates with CLTV discussed later in this article.
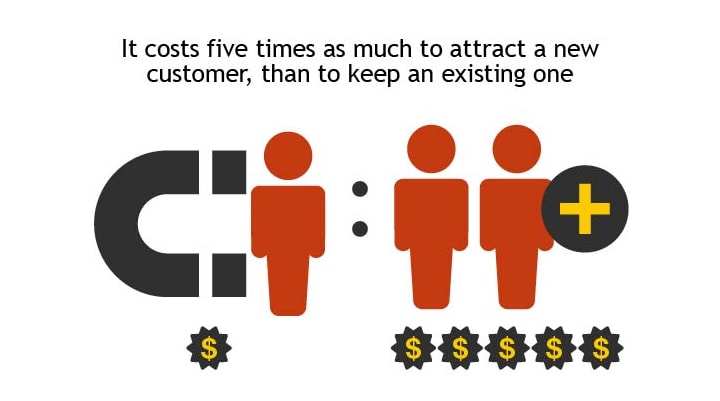
Customer Acquisition Cost (CAC) Of Referrals
Also known as acquisition cost, it is the most significant metric for a referral campaign. This value helps you determine the amount required to acquire a single user. This is essentially the sum total of money spent on generating a lead (in this case spends on making users aware about your referrals) and the cost of converting them into a loyalist.
The easiest way to find the CAC while running referrals is by using the formula below
Customer Life Time Value
Customer Life Time value helps in determining the real value that a user (acquired via referrals) brings to your app. This is slightly different than standard CLTV value since we are excluding other sources of acquisition and focussing entirely on acquisition and revenue from users that came via referrals.
A few fundamental factors that define CLTV are how often your referred users make a transaction, the value of a transaction and how long users acquired via referrals stay your customers.
Loyal Customer Value
A customer that continues to refer more users is deemed as a loyal one. It is a meaningful metric which is often ignored in the presence of CLTV. To make a better judgment of their referral campaign, Marketers need to remember that both CLTV and Loyal customer are separate metrics and shouldn’t be gauged as one.
Studies have shown that referred customers are more loyal and have a higher LTV than users acquired via other methods. Marketers also need to remember the thumb rule around CLTV- it should be greater than CPA.
Customer Retention Rate (via Referrals)
Customer retention rate is nothing but the proportion of users that have stayed with you for a while- in this case, the ones acquired via referrals. CRR data can be maintained for monthly, weekly or yearly basis.
CE = number of users acquired via referrals at the end of a specified period
CN = number of users acquired via referrals during the period
CS = number of users acquired via referrals at the start of the period
CRR is opposite of churn rate- A 20% CRR means 80% churn and likewise.

To be able to have a clear demarcation, CRR for referrals should be calculated separately from other app metrics. Customer Retention Rate is also an indicator of user loyalty and helps Marketers in evaluating customer satisfaction levels. Most Marketers understand the real value of retention and the challenges associated with it. Acquiring a user is far easier than retaining them, and therefore, this metric is a much-regarded number while evaluating the health of your referral campaign.
Section 2- User Level Metrics
Invitees Per Referer
The number of invites generated by a referrer is yet another metric that often goes missing when Marketers evaluate their referral campaign. Invitees per referer is a significant metric because it helps you to filter your most loyal referrers or influencers from a vast set of people participating in your refer and earn campaign.
This metric provides sufficient data to Marketers to check their revised referral and incentive strategy.
Clicks Per Invite
Invites Per Referer has a sub-metrics that need to be taken into account. Given that referral codes/links can be shared through multiple channels such as Twitter, Facebook, Emails and Whatsapp; identifying the most popular platform becomes key to improvement.
Each referral link/code has two ends. One that’s initiated at the referrer’s end (sharing and the other that closes at recipient’s (friend’s) end. Clicks Per Invite is a conversion metric that helps in estimating the number of clicks by a recipient on a referral link.
Marketers can use it in checking and updating the message and presentation of their referral links. For example, whether personalized links attracted more clicks as compared to generic links.
Installs Per Invite
The end goal of every app referral program is to achieve app installs. Hence tracking installs per invite becomes a crucial metric to consider while running referral campaigns.
As a mobile app marketer it is crucial that you are able to track how many installs does each invite or referral link generates.
Churn Rate For Referrals ( Inactive Users)
Churn is the sum total of users who have stopped participating in your referrals campaign during a specific period of time and is mentioned as a percentage value.
Section 3 – Complementary Metrics
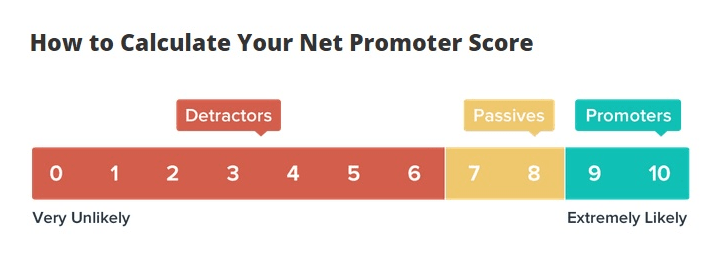
Net Promoter Score
Net Promoter Score is a scale based metric that calculates the willingness of users to refer a new user and therefore a must while checking the impact of a referral campaign.
A lot of Marketers may see NPS as a vanity metric, however one cannot ignore its usability while executing referral marketing campaigns. We have discussed the way to measure NPS in an earlier article here.
K- factor
In viral/referral marketing, the K-factor is commonly used to describe the growth rate/virality of a mobile app.
The formula is roughly as follows:
c = percent conversion of each invite (e.g. if one in five invitees convert to new users, c = .2)
k = i x c
Over To You
Which referral metrics are the most significant to you? What’s your take on the metrics listed above? Did we miss anything? We would love to know your feedback, so don’t miss on commenting below!
Image Source: Bigbangtheory | Invespcro